
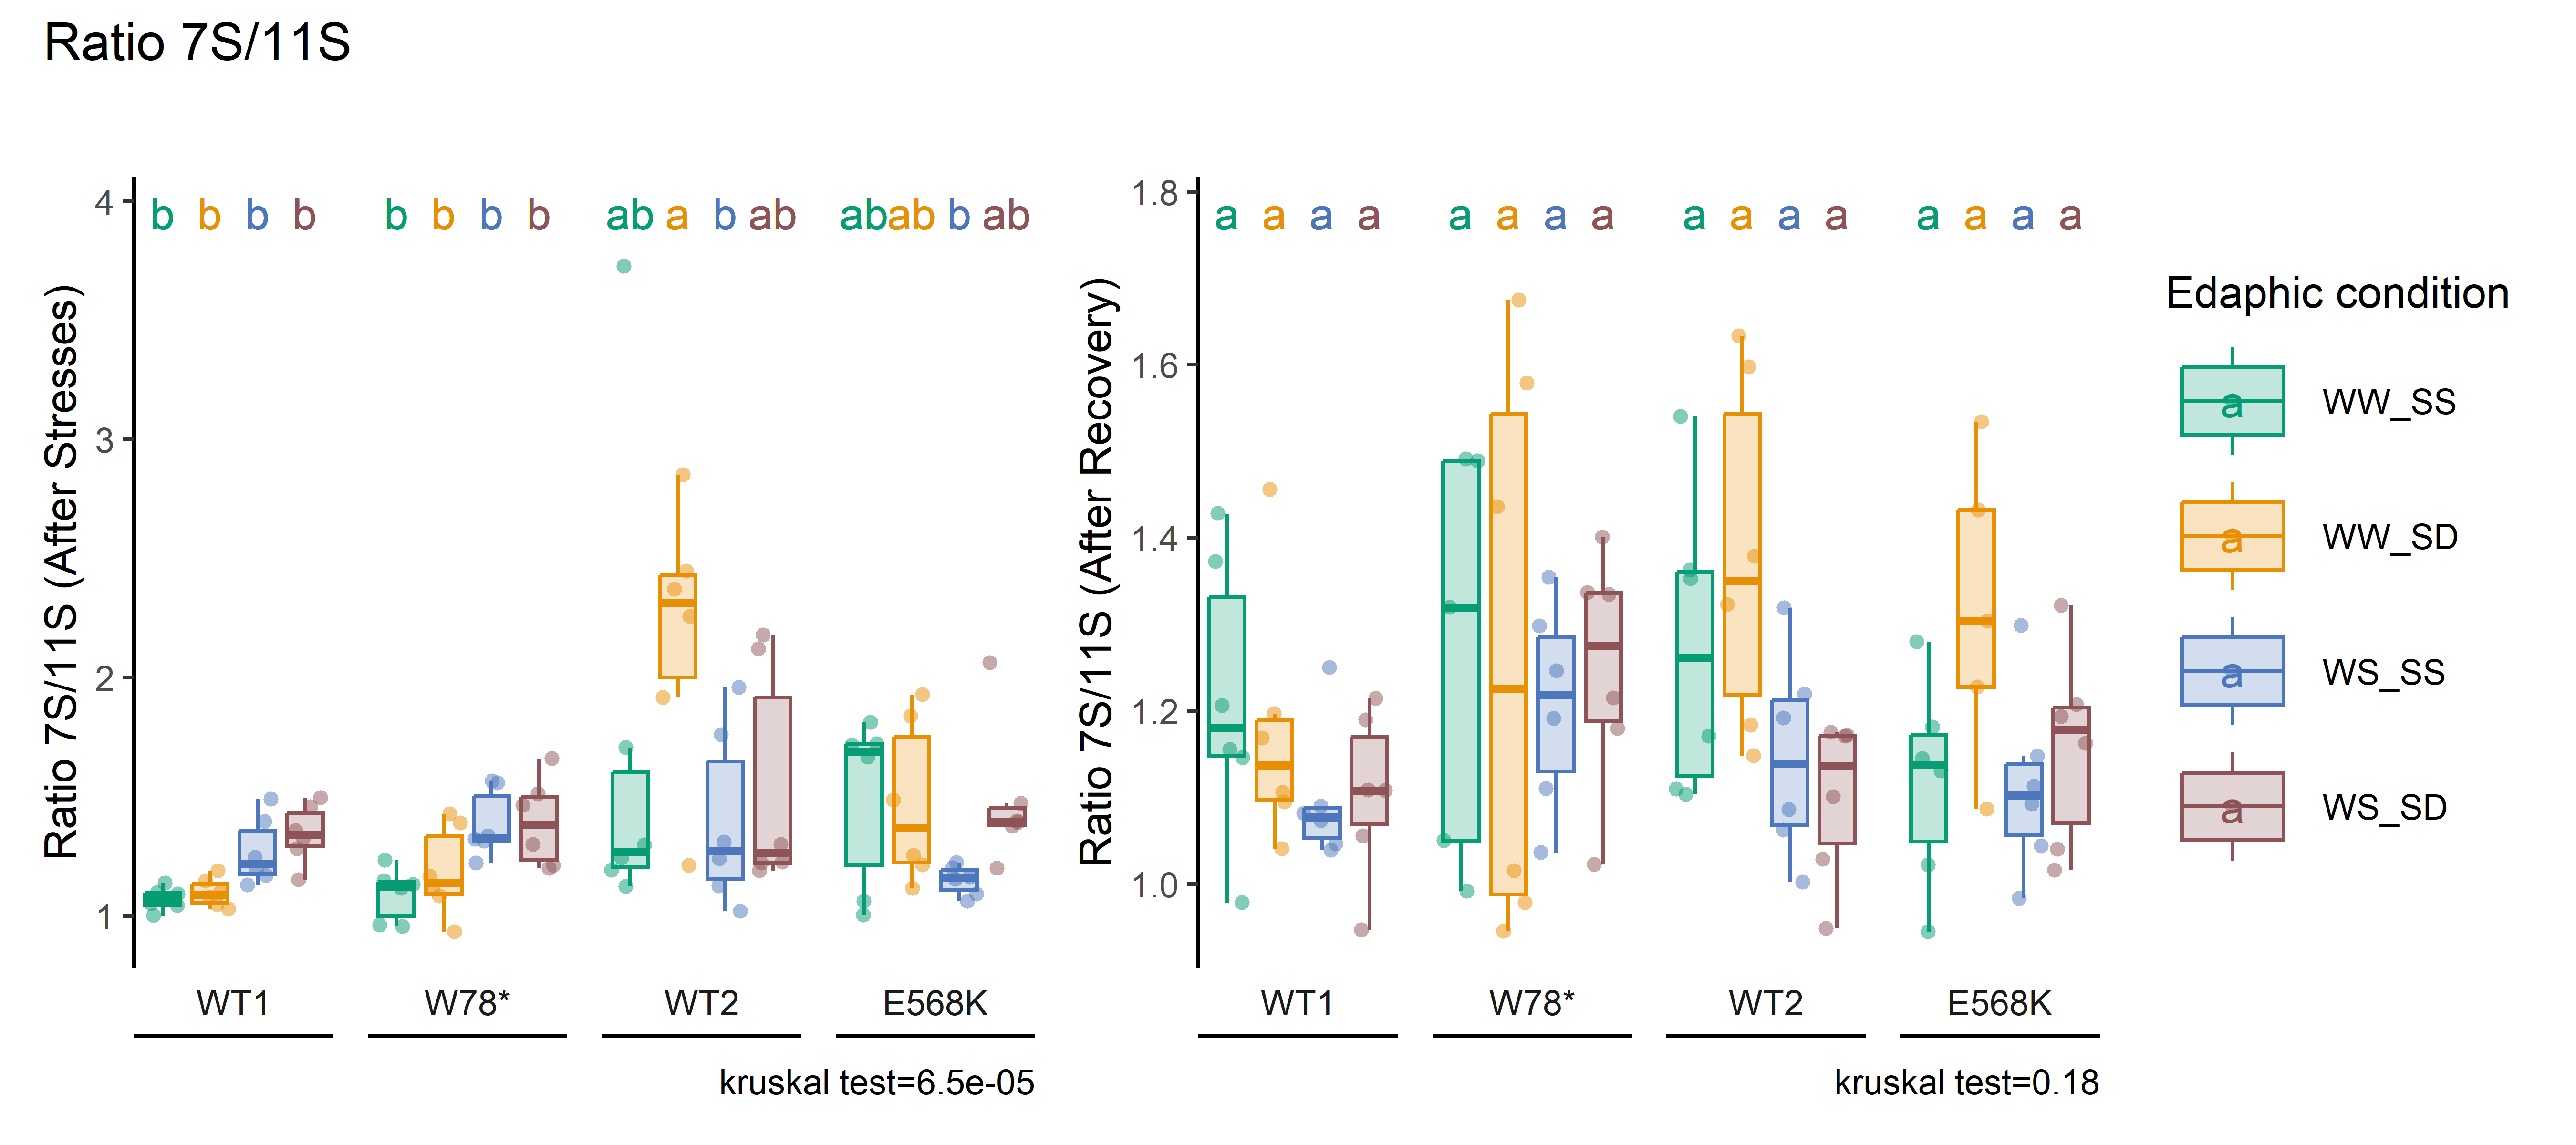
Seed protein composition of mature seeds by SDS-PAGE.
Image analysis using CLIQS software.
Code
#pkg library(tidyverse)library(patchwork)source(here::here("src/function/stat_function/stat_analysis_main.R")) # for make plot source(here::here("src/function/fig_export.R")) # This function saves a given plot (plot_x) as both a PDF and a high-resolution PNG file at specified dimensions.# cosmeticspallet=read_excel(here::here("data/color_palette.xlsm")) %>%filter(set =="edaphic_condition") %>% dplyr::select(color, treatment) %>%pull(color) %>%setNames(read_excel(here::here("data/color_palette.xlsm")) %>%filter(set =="edaphic_condition") %>%pull(treatment) )
4.1 Data importation
Code
# data importationgels_plan =read.table(here::here("data/physio/protein_composition/Gels_plan.txt"), sep ="\t", header =TRUE) %>%mutate(Gel_Lane=paste0(Gel,"_",Lane))Protein_identif =read.table(here::here("data/physio/protein_composition/Protein_identification.txt"), sep ="\t", header =TRUE)Gel_1 =read.table(here::here("data/physio/protein_composition/Main stem, stresses_Rep 1_Gel 1_Raw_data.txt"), sep ="\t", dec =",", header =TRUE) # Empty lane already removed in raw fileGel_2 =read.table(here::here("data/physio/protein_composition/Main stem, stresses_Rep 1_Gel 2_Raw_data.txt"), sep ="\t", dec =",", header =TRUE) # Empty lane already removed in raw fileGel_3 =read.table(here::here("data/physio/protein_composition/Main stem, stresses_Rep 1_Gel 3_Raw_data.txt"), sep ="\t", dec =",", header =TRUE) # Empty lane already removed in raw fileGel_4 =read.table(here::here("data/physio/protein_composition/Main stem, stresses_Rep 1_Gel 4_Raw_data.txt"), sep ="\t", dec =",", header =TRUE) # Empty lane already removed in raw fileFile_4_gels_1_S <-rbind(Gel_1, Gel_2, Gel_3, Gel_4) %>%mutate(rep=1) %>%mutate(dev="stresses")Gel_1 =read.table(here::here("data/physio/protein_composition/Main stem, recovery_Rep 1_Gel 1_Raw_data.txt"), sep ="\t", dec =",", header =TRUE) # Empty lane was lane 14, already removed in raw fileGel_2 =read.table(here::here("data/physio/protein_composition/Main stem, recovery_Rep 1_Gel 2_Raw_data.txt"), sep ="\t", dec =",", header =TRUE) # Empty lane was lane 13, already removed in raw fileGel_3 =read.table(here::here("data/physio/protein_composition/Main stem, recovery_Rep 1_Gel 3_Raw_data.txt"), sep ="\t", dec =",", header =TRUE) # No empty laneGel_4 =read.table(here::here("data/physio/protein_composition/Main stem, recovery_Rep 1_Gel 4_Raw_data.txt"), sep ="\t", dec =",", header =TRUE) # No empty laneFile_4_gels_1_R <-rbind(Gel_1, Gel_2, Gel_3, Gel_4) %>%mutate(rep=1) %>%mutate(dev="recovery")# function to add info to each geladd_info_gel<-function(File_4_gels_X){ File_4_gels_X=File_4_gels_X %>%mutate(Gel_Lane=paste0(Gel,"_",Lane)) %>%left_join(., gels_plan %>% dplyr::select(Condition,Genotype,Gel_Lane), by ="Gel_Lane") %>%mutate(Genotype_Condition=paste0(Genotype,"_",Condition)) %>%left_join(., Protein_identif %>% dplyr::select(Band,S,Protein), by ="Band") %>%filter(Lane!="Lane 1") %>% dplyr::select(-"MW") %>%separate(Condition, into =c("water_condition", "sulfur_condition"), sep ="_", remove = T) %>%mutate(sulfur_condition =ifelse(sulfur_condition =="S+", "SS", "SD"),water_condition =ifelse(water_condition =="W+", "WW", "WS")) %>%mutate(family=ifelse(Genotype=="WT1","1",ifelse(Genotype=="W78*","1",ifelse(Genotype=="WT2","2",ifelse(Genotype=="E568K","2","error"))))) %>%mutate(type_genotype=ifelse(Genotype=="WT1","WT",ifelse(Genotype=="W78*","Mutant",ifelse(Genotype=="WT2","WT",ifelse(Genotype=="E568K","Mutant","error"))))) %>% dplyr::rename(genotype = Genotype,condition = Genotype_Condition, volume = Volume, band = Band, lane = Lane, gel = Gel, gel_lane = Gel_Lane, protein = Protein) %>%mutate(genotype =fct_relevel(genotype, "WT1", "W78*", "WT2", "E568K"), dev =as.factor(dev) ) File_4_gels_X$num_plant=rep(1:96, each =20)return(File_4_gels_X)}all_gels=rbind(add_info_gel(File_4_gels_1_S),add_info_gel(File_4_gels_1_R) ) %>%mutate(dev =fct_relevel(dev, "stresses", "recovery"))# code de fanelie (pas certain de ce qu'elle a fais)all_gels_resum=all_gels %>% dplyr::group_by(num_plant,gel,water_condition, sulfur_condition,genotype,dev) %>%mutate(norm_volume=(volume/sum(volume)*100)) %>%mutate(sum_lane=sum(volume)) %>%ungroup() %>% dplyr::group_by(S,num_plant,gel,water_condition, sulfur_condition, genotype, dev) %>%mutate(sum_S=sum(norm_volume)) %>%ungroup() %>% dplyr::group_by(protein,num_plant,gel,water_condition, sulfur_condition, genotype, dev) %>%mutate(sum_protein=sum(norm_volume)) %>%ungroup() %>% dplyr::group_by(S,num_plant,gel,water_condition, sulfur_condition, genotype, dev) %>%mutate(edaphic_condition =paste(sep ="_", water_condition, sulfur_condition), sample_id =paste(sep ="_", band, num_plant, gel_lane,S,dev)) %>%distinct(S, num_plant, gel, water_condition, sulfur_condition, genotype, dev, sum_S, .keep_all =TRUE) %>%# j'ai rajouter ça pour enlever les doublonsmutate(dev =str_to_title(dev),dev =as.factor(dev),dev =fct_relevel(dev, "Stresses", "Recovery"))all_gels_resum %>%ggplot(aes(x = edaphic_condition, y = sum_S, fill = genotype)) +geom_boxplot() +facet_grid(S ~ dev, scales ="free_y")min(all_gels_resum$sum_S, na.rm = T)max(all_gels_resum$sum_S, na.rm = T)# with statsvect_variable_combine <-c("2S_Stresses", "2S_Recovery" ,"7S_Stresses", "7S_Recovery", "11S_Stresses" ,"11S_Recovery", "None_Stresses", "None_Recovery" )plots <-lapply(1:length(vect_variable_combine), function(i) {cat_col(c(vect_variable_combine[i],"\n"),color ="green") variable_i =sapply(strsplit(vect_variable_combine, "_"), `[`, 1)[i] dev_i =sapply(strsplit(vect_variable_combine, "_"), `[`, 2)[i] df_select_t<-all_gels_resum %>%mutate(variable = S) %>%filter(variable==variable_i, dev == dev_i) %>%drop_na(sum_S) %>%as.data.frame() p <-stat_analyse(data=df_select_t,column_value ="sum_S",category_variables ="edaphic_condition",grp_var ="genotype",show_plot = T,outlier_show = F, label_outlier ="sample_id",biologist_stats = T,Ylab_i =paste0(variable_i, " (After ", dev_i,")(%)"),control_conditions ="WW_SS",strip_normale = F,hex_pallet = pallet ) p <-p[["plot"]]+labs(color="Edaphic condition",fill="Edaphic condition", x="Genotype")# +coord_cartesian(ylim = c(3, 60)) # not workingprint(p)})# Assembling graphicsfinal_plot <-wrap_plots(plots, ncol =2)+plot_layout(guides ="collect")+plot_annotation(#tag_levels = 'A',title=paste0("Protein composition"),subtitle="")&theme(legend.position ='bottom')fig_export(here::here(paste0("report/physio/plot/protein_composition")), final_plot, height_i =14, width_i =16, res_i =600)############ ratio 7S/11Sall_gels_resum_ratio=all_gels %>% dplyr::group_by(num_plant,gel,water_condition, sulfur_condition,genotype,dev,type_genotype) %>%mutate(norm_volume=(volume/sum(volume)*100)) %>%mutate(sum_lane=sum(volume)) %>%ungroup() %>% dplyr::group_by(S,num_plant,gel,water_condition, sulfur_condition,genotype,dev,type_genotype,family) %>% dplyr::summarise(sum_S=sum(norm_volume)) %>%pivot_wider(names_from = S,values_from =sum_S) %>%mutate(ratio=`7S`/`11S`) %>%mutate(water_condition =as.factor(water_condition)) %>%mutate(sulfur_condition =as.factor(sulfur_condition)) %>%mutate(genotype =as.factor(genotype)) %>%mutate(water_condition =relevel(water_condition, ref ="WW")) %>%mutate(sulfur_condition =relevel(sulfur_condition, ref ="SD")) %>%mutate(genotype =fct_relevel(genotype, "WT1", "W78*", "WT2", "E568K")) %>%mutate(sample_id =paste(sep ="_", num_plant, gel, dev, genotype),edaphic_condition =paste0(water_condition, "_", sulfur_condition), dev =str_to_title(dev)) vect_variable <-c("Stresses", "Recovery")plots <-lapply(1:length(vect_variable), function(i) {cat_col(c(vect_variable[i],"\n"),color ="green") dev_i = vect_variable[i] df_select_t<-all_gels_resum_ratio %>%filter(dev == dev_i) %>%drop_na(ratio) %>%as.data.frame() p <-stat_analyse(data=df_select_t,column_value ="ratio",category_variables ="edaphic_condition",grp_var ="genotype",show_plot = T,outlier_show = F, label_outlier ="sample_id",biologist_stats = T,Ylab_i =paste0("Ratio 7S/11S (After ", dev_i,")"),control_conditions ="WW_SS",strip_normale = F,hex_pallet = pallet ) p <-p[["plot"]]+labs(color="Edaphic condition",fill="Edaphic condition", x="Genotype")# +coord_cartesian(ylim = c(3, 60)) # not workingprint(p)})# Assembling graphicsfinal_plot <-wrap_plots(plots, ncol =2)+plot_layout(guides ="collect")+plot_annotation(#tag_levels = 'A',title=paste0("Ratio 7S/11S"),subtitle="")&theme(legend.position ='right')fig_export(here::here(paste0("report/physio/plot/protein_composition_7S_11S")), final_plot, height_i =4, width_i =9, res_i =600)
Source Code
---output: html_documenteditor_options: chunk_output_type: console---## Seed protein composition - Seed protein composition of mature seeds by SDS-PAGE. - Image analysis using CLIQS software. ```{r}#pkg library(tidyverse)library(patchwork)source(here::here("src/function/stat_function/stat_analysis_main.R")) # for make plot source(here::here("src/function/fig_export.R")) # This function saves a given plot (plot_x) as both a PDF and a high-resolution PNG file at specified dimensions.# cosmeticspallet=read_excel(here::here("data/color_palette.xlsm")) %>%filter(set =="edaphic_condition") %>% dplyr::select(color, treatment) %>%pull(color) %>%setNames(read_excel(here::here("data/color_palette.xlsm")) %>%filter(set =="edaphic_condition") %>%pull(treatment) )```## Data importation ```{r, eval = F}# data importationgels_plan = read.table(here::here("data/physio/protein_composition/Gels_plan.txt"), sep = "\t", header = TRUE) %>% mutate(Gel_Lane=paste0(Gel,"_",Lane))Protein_identif = read.table(here::here("data/physio/protein_composition/Protein_identification.txt"), sep = "\t", header = TRUE)Gel_1 = read.table(here::here("data/physio/protein_composition/Main stem, stresses_Rep 1_Gel 1_Raw_data.txt"), sep = "\t", dec = ",", header = TRUE) # Empty lane already removed in raw fileGel_2 = read.table(here::here("data/physio/protein_composition/Main stem, stresses_Rep 1_Gel 2_Raw_data.txt"), sep = "\t", dec = ",", header = TRUE) # Empty lane already removed in raw fileGel_3 = read.table(here::here("data/physio/protein_composition/Main stem, stresses_Rep 1_Gel 3_Raw_data.txt"), sep = "\t", dec = ",", header = TRUE) # Empty lane already removed in raw fileGel_4 = read.table(here::here("data/physio/protein_composition/Main stem, stresses_Rep 1_Gel 4_Raw_data.txt"), sep = "\t", dec = ",", header = TRUE) # Empty lane already removed in raw fileFile_4_gels_1_S <- rbind(Gel_1, Gel_2, Gel_3, Gel_4) %>% mutate(rep=1) %>% mutate(dev="stresses")Gel_1 = read.table(here::here("data/physio/protein_composition/Main stem, recovery_Rep 1_Gel 1_Raw_data.txt"), sep = "\t", dec = ",", header = TRUE) # Empty lane was lane 14, already removed in raw fileGel_2 = read.table(here::here("data/physio/protein_composition/Main stem, recovery_Rep 1_Gel 2_Raw_data.txt"), sep = "\t", dec = ",", header = TRUE) # Empty lane was lane 13, already removed in raw fileGel_3 = read.table(here::here("data/physio/protein_composition/Main stem, recovery_Rep 1_Gel 3_Raw_data.txt"), sep = "\t", dec = ",", header = TRUE) # No empty laneGel_4 = read.table(here::here("data/physio/protein_composition/Main stem, recovery_Rep 1_Gel 4_Raw_data.txt"), sep = "\t", dec = ",", header = TRUE) # No empty laneFile_4_gels_1_R <- rbind(Gel_1, Gel_2, Gel_3, Gel_4) %>% mutate(rep=1) %>% mutate(dev="recovery")# function to add info to each geladd_info_gel<-function(File_4_gels_X){ File_4_gels_X=File_4_gels_X %>% mutate(Gel_Lane=paste0(Gel,"_",Lane)) %>% left_join(., gels_plan %>% dplyr::select(Condition,Genotype,Gel_Lane), by = "Gel_Lane") %>% mutate(Genotype_Condition=paste0(Genotype,"_",Condition)) %>% left_join(., Protein_identif %>% dplyr::select(Band,S,Protein), by = "Band") %>% filter(Lane!="Lane 1") %>% dplyr::select(-"MW") %>% separate(Condition, into = c("water_condition", "sulfur_condition"), sep = "_", remove = T) %>% mutate(sulfur_condition = ifelse(sulfur_condition == "S+", "SS", "SD"), water_condition = ifelse(water_condition == "W+", "WW", "WS")) %>% mutate(family=ifelse(Genotype=="WT1","1",ifelse(Genotype=="W78*","1",ifelse(Genotype=="WT2","2",ifelse(Genotype=="E568K","2","error"))))) %>% mutate(type_genotype=ifelse(Genotype=="WT1","WT",ifelse(Genotype=="W78*","Mutant",ifelse(Genotype=="WT2","WT",ifelse(Genotype=="E568K","Mutant","error"))))) %>% dplyr::rename(genotype = Genotype, condition = Genotype_Condition, volume = Volume, band = Band, lane = Lane, gel = Gel, gel_lane = Gel_Lane, protein = Protein) %>% mutate(genotype = fct_relevel(genotype, "WT1", "W78*", "WT2", "E568K"), dev = as.factor(dev) ) File_4_gels_X$num_plant=rep(1:96, each = 20) return(File_4_gels_X)}all_gels=rbind(add_info_gel(File_4_gels_1_S), add_info_gel(File_4_gels_1_R) ) %>% mutate(dev = fct_relevel(dev, "stresses", "recovery"))# code de fanelie (pas certain de ce qu'elle a fais)all_gels_resum=all_gels %>% dplyr::group_by(num_plant,gel,water_condition, sulfur_condition,genotype,dev) %>% mutate(norm_volume=(volume/sum(volume)*100)) %>% mutate(sum_lane=sum(volume)) %>% ungroup() %>% dplyr::group_by(S,num_plant,gel,water_condition, sulfur_condition, genotype, dev) %>% mutate(sum_S=sum(norm_volume)) %>% ungroup() %>% dplyr::group_by(protein,num_plant,gel,water_condition, sulfur_condition, genotype, dev) %>% mutate(sum_protein=sum(norm_volume)) %>% ungroup() %>% dplyr::group_by(S,num_plant,gel,water_condition, sulfur_condition, genotype, dev) %>% mutate(edaphic_condition = paste(sep = "_", water_condition, sulfur_condition), sample_id = paste(sep = "_", band, num_plant, gel_lane,S,dev)) %>% distinct(S, num_plant, gel, water_condition, sulfur_condition, genotype, dev, sum_S, .keep_all = TRUE) %>% # j'ai rajouter ça pour enlever les doublons mutate(dev = str_to_title(dev), dev = as.factor(dev), dev = fct_relevel(dev, "Stresses", "Recovery"))all_gels_resum %>% ggplot(aes(x = edaphic_condition, y = sum_S, fill = genotype)) + geom_boxplot() + facet_grid(S ~ dev, scales = "free_y")min(all_gels_resum$sum_S, na.rm = T)max(all_gels_resum$sum_S, na.rm = T)# with statsvect_variable_combine <- c("2S_Stresses", "2S_Recovery" ,"7S_Stresses", "7S_Recovery", "11S_Stresses" ,"11S_Recovery", "None_Stresses", "None_Recovery" )plots <- lapply(1:length(vect_variable_combine), function(i) { cat_col(c(vect_variable_combine[i],"\n"),color = "green") variable_i = sapply(strsplit(vect_variable_combine, "_"), `[`, 1)[i] dev_i = sapply(strsplit(vect_variable_combine, "_"), `[`, 2)[i] df_select_t<-all_gels_resum %>% mutate(variable = S) %>% filter(variable==variable_i, dev == dev_i) %>% drop_na(sum_S) %>% as.data.frame() p <- stat_analyse( data=df_select_t, column_value = "sum_S", category_variables = "edaphic_condition", grp_var = "genotype", show_plot = T, outlier_show = F, label_outlier = "sample_id", biologist_stats = T, Ylab_i = paste0(variable_i, " (After ", dev_i,")(%)"), control_conditions = "WW_SS", strip_normale = F, hex_pallet = pallet ) p <-p[["plot"]]+labs(color="Edaphic condition",fill="Edaphic condition", x= "Genotype")# +coord_cartesian(ylim = c(3, 60)) # not working print(p)})# Assembling graphicsfinal_plot <- wrap_plots(plots, ncol = 2)+ plot_layout(guides = "collect")+ plot_annotation(#tag_levels = 'A', title=paste0("Protein composition"), subtitle="")& theme(legend.position = 'bottom')fig_export(here::here(paste0("report/physio/plot/protein_composition")), final_plot, height_i = 14, width_i = 16, res_i = 600)############ ratio 7S/11Sall_gels_resum_ratio=all_gels %>% dplyr::group_by(num_plant,gel,water_condition, sulfur_condition,genotype,dev,type_genotype) %>% mutate(norm_volume=(volume/sum(volume)*100)) %>% mutate(sum_lane=sum(volume)) %>% ungroup() %>% dplyr::group_by(S,num_plant,gel,water_condition, sulfur_condition,genotype,dev,type_genotype,family) %>% dplyr::summarise(sum_S=sum(norm_volume)) %>% pivot_wider(names_from = S,values_from =sum_S) %>% mutate(ratio=`7S`/`11S`) %>% mutate(water_condition = as.factor(water_condition)) %>% mutate(sulfur_condition = as.factor(sulfur_condition)) %>% mutate(genotype = as.factor(genotype)) %>% mutate(water_condition = relevel(water_condition, ref = "WW")) %>% mutate(sulfur_condition = relevel(sulfur_condition, ref = "SD")) %>% mutate(genotype = fct_relevel(genotype, "WT1", "W78*", "WT2", "E568K")) %>% mutate(sample_id = paste(sep = "_", num_plant, gel, dev, genotype), edaphic_condition = paste0(water_condition, "_", sulfur_condition), dev = str_to_title(dev)) vect_variable <- c("Stresses", "Recovery")plots <- lapply(1:length(vect_variable), function(i) { cat_col(c(vect_variable[i],"\n"),color = "green") dev_i = vect_variable[i] df_select_t<-all_gels_resum_ratio %>% filter(dev == dev_i) %>% drop_na(ratio) %>% as.data.frame() p <- stat_analyse( data=df_select_t, column_value = "ratio", category_variables = "edaphic_condition", grp_var = "genotype", show_plot = T, outlier_show = F, label_outlier = "sample_id", biologist_stats = T, Ylab_i = paste0("Ratio 7S/11S (After ", dev_i,")"), control_conditions = "WW_SS", strip_normale = F, hex_pallet = pallet ) p <-p[["plot"]]+labs(color="Edaphic condition",fill="Edaphic condition", x= "Genotype")# +coord_cartesian(ylim = c(3, 60)) # not working print(p)})# Assembling graphicsfinal_plot <- wrap_plots(plots, ncol = 2)+ plot_layout(guides = "collect")+ plot_annotation(#tag_levels = 'A', title=paste0("Ratio 7S/11S"), subtitle="")& theme(legend.position = 'right')fig_export(here::here(paste0("report/physio/plot/protein_composition_7S_11S")), final_plot, height_i = 4, width_i = 9, res_i = 600)```